tl;dr: check out our summarised review of StocksCafe here! Referral link included
If you’re reading this blog and other personal finance blogs, you probably have started to or are interested in investing for your future. Investing can be hard enough to get started, but I (PB) think the hardest part is sticking with your investment strategy for the long term. To do that, you probably need to have as much clarity over your portfolio as possible.
That’s where portfolio tracking comes in.
Tracking your portfolio constantly and over a long period of time is the most feasible way to see how it’s doing now, in the past, and compared to the past. Unless you have the mental capacity to both remember and calculate everything (time-weighted returns; XIRR; dividend yield; performance against a benchmark index; etc.) in your head, you’ll probably need a tool to help you do this. If you have a standard stocks-bonds portfolio, you’ll need to record your transactions: what you bought, how much it costed, how much commissions you paid, how much dividends you get. But after you do that, you’ll want to see how it’s doing: how much annual return is that stock giving, how much is your yield on cost etc. This can be done in Excel (I personally use Google Sheets adapted from InvestmentMoats), but anyone who’s tried to create / adapt their own tracker sheet knows how difficult it is to both create and maintain: you have to set your own calculations and create a new formula for every new metric you want to track, you have to constantly maintain API / web scraping access to data like stock prices, etc. Time is money, and unless you’re doing this to practice your Excel skills (or web development skills if you’re so inclined to create your own site), a reliable tool would be helpful.
That’s where StocksCafe comes in. But what is it exactly?
Created by Evan Koh, StocksCafe is an all-in-one portfolio tracking platform that is increasingly popular in Singapore. It is widely used and very positive rated, deservedly so. Its basic version is free to use (yet doesn’t suck), offers a wide variety of features for investors, and allows you to track your portfolio performance automatically. Best of all, its internal forum is pretty active and feature requests / bugs are very actively dealt with by Evan. I (and I think quite a few others) have personally asked him if he would accept help with feature requests as I do have some relevant experience, but for now he has decided to handle this alone.
In this post, I’ll try to cover a few of the things that I personally have used (not everything as I’m kind of a lazy investor oops). From there, you can see if it suits you, and try it out for free! Of course, I’m not the first, nor will I be the last, to review this pretty amazing platform 🙂
disclaimer: referral links included. All screenshots are taken from my personal StocksCafe premium account, dated 26/2/2021 🙂
Portfolio Tracking

Of course, StocksCafe is known as a portfolio tracker, and the Portfolio tab is where we’ll start.
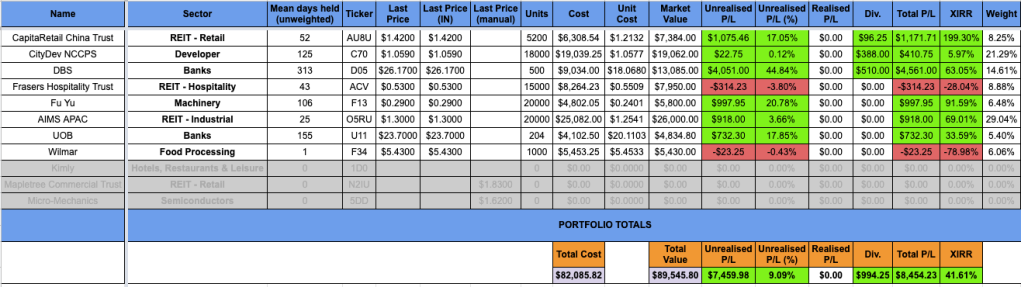
The Portfolio tab is the overview of your portfolio, where you can compare it against benchmarks (#1), break down to individual portfolios (#2), and of course track it by currency (#3), and view details such as current P&L, dividends, and closed P&L. Also circled in #3 is the pretty nifty tidbit about your portfolio’s estimated Beta, Value-At-Risk (VaR) and Expected Shortfall (technical aspects and their explanations here). I particularly appreciate the ability to breakdown to individual portfolios (#2), as it allows me to benchmark different parts of my portfolio against different things. In my own Google Sheets tracking, this is exceedingly time-consuming to do. For example, I have a big chunk of my portfolio in ETFs as shown above, but I also have individual stock holdings which are inherently more risky and volatile, but I can track their performances separately, which is helpful for me to evaluate my individual stock picks. You can also see your portfolio’s current yield, cost yield and projected yield (more details later).
Portfolio Report

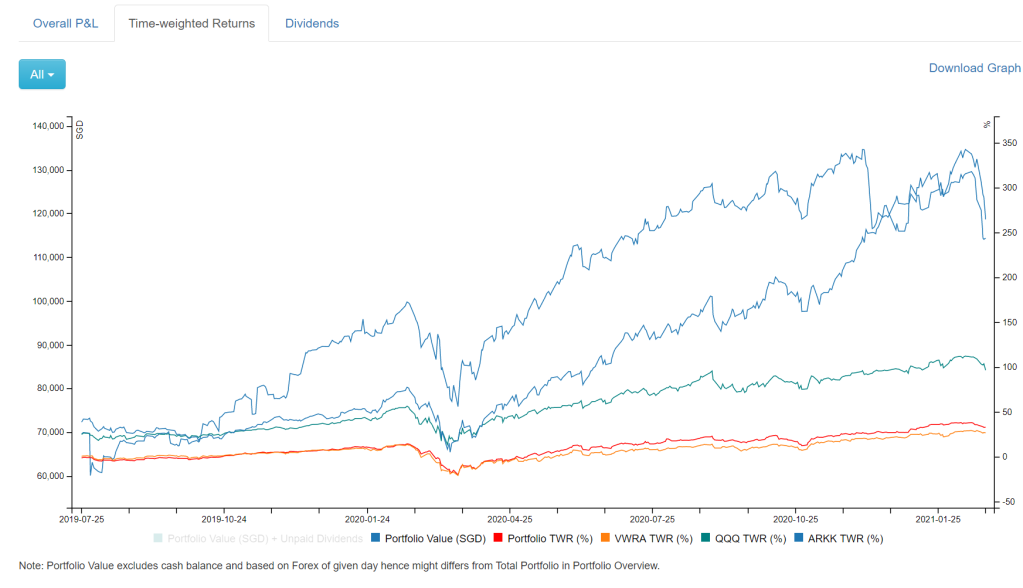
One of my most visited tabs after the overview is the report. It contains quite a bit of information in a concise and well-organised manner. Specifically, this tab shows your portfolio’s time-weighted returns net of dividends and fees, its monthly volatility, max drawdown, XIRR & capital flow, paid & projected dividends, and P&L. Of course, you can benchmark these against your favourite benchmarks, and view these for any specific portfolio breakdown that you have. These statistics can be helpful for evaluating your portfolio performance and decision-making: for example, if you’re consistently underperforming a market index without having a specific strategy in mind while having worse volatility, you might be better off just following that index. This is difficult to do in my own Google Sheets as well, as getting this data over time consistently can be quite difficult. Of course, you can view the returns in chart form as well:
Dividends
Being Singaporeans, dividends are our favourite word when it comes to investing, and to be honest, StocksCafe’s dividends visualisation and tracking is one of the best I’ve used (and I’ve tried quite a lot of tools for dividend tracking).

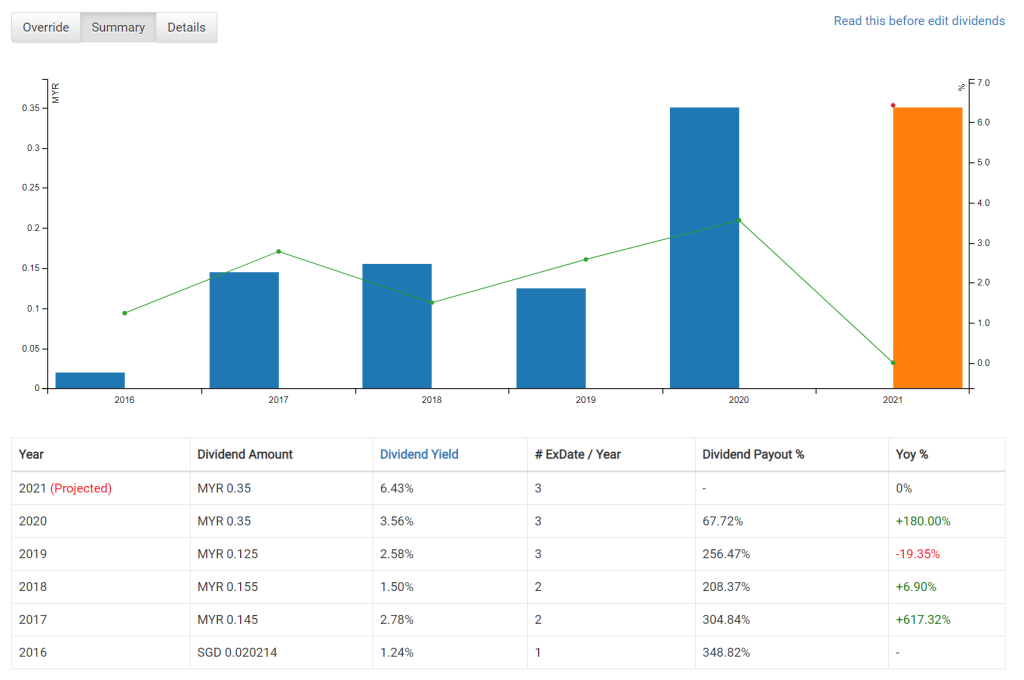
You can view both announced and paid dividends, and even see your projected dividends. Best of all, because not all data providers have 24/7 immediately accurate dividend information, you can even manually override the dividend values if they are wrong.
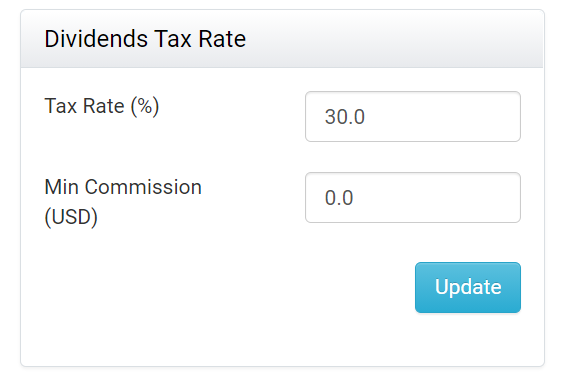
Did I mention it also handles dividend withholding tax? The bottom image is an example of the (automatic) dividend tax rate that can be seen when you go to an individual stock page. Of course, Singapore doesn’t have dividend withholding tax for Singaporeans (not sure about non-Singaporeans), so if you’re only invested in the SGX, this is not a worry! But for me and others like me who have invested in non-SGX stuff, having this done automatically is very helpful.
Community: Shared Screeners & Portfolios

StocksCafe also has a pretty comprehensive screener. Interested in finding stocks fitting your own requirements? Head on to the screener, and check out the publicly shared screeners, or create your own. There’s a bunch of conditions, including both fundamental and technical, and you search by Exchanges as well. You can even set conditions as mandatory or not. Of course, you can click on the results to view more information about a particular security.


Other detailed tabs include their financial / dividend information, which I won’t go into too much detail here. One thing I must mention as I like a lot is the dividend charting, as if I’m investing in a dividend stock, I want to see that it’s generally increasing its dividend per share, which is best viewed with a graph:
And in case you were wondering where to view the dividend tax rate, it’s in the same Summary page (scroll down). Of course, this example is a Singapore stock, so no dividend tax 🙂

In this same page, you even make your own notes, view your past transactions in this security, and even view what members of the community are doing regarding this security e.g. how many of them hold it, what price they bought it at etc. If you click on the “2.9% holds BVA (10/341)”, you will see what other people hold (only those who make their portfolio public):

You can then view what other investors have, and like / follow other investors.
Friend of StocksCafe
Overall, I really like the community aspect of StocksCafe. If you sign up as a Friend of StocksCafe (referral link), you also get a Friends forum which lets you raise bugs / feature requests, which Evan and other Friends can view and comment on. As a developer myself, I have realised that an iterative development process is very important, but can only be done with constant feedback loops between the developer and the user. In this aspect, StocksCafe definitely has done very well.
As an example of listening to StocksCafe’s users, Singaporean investors in the past few years have started to invest more into Ireland-domiciled world ETFs for the lower dividend withholding tax, and some of the more popular ETFs are listed on the London Stock Exchange (LSE). While the LSE is not commonly provided in data providers, Evan went to search for alternative providers just so he could get LSE data as many community members were requesting for it.
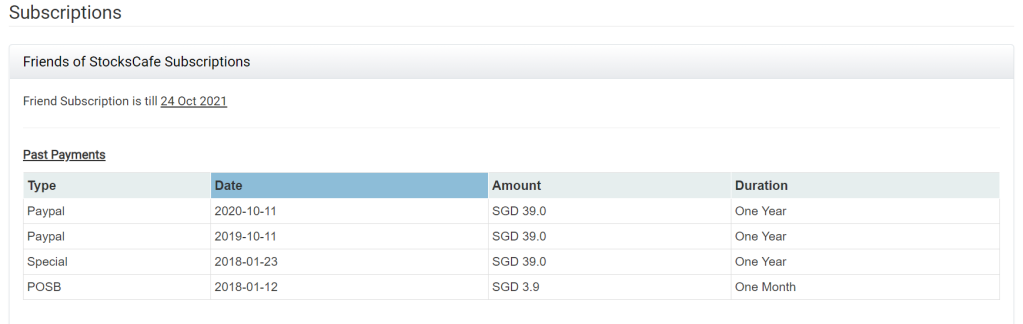
I used to be pretty stingy about paying for stuff, but I have come to realise that you get what you pay for. While Google Sheets is certainly free for me to maintain, it’s quite a lot of effort, and the features that Evan has provided in this wonderful tool certainly make his platform worth a try (prices below). If you’re happy with the basic features and would like to use the full suite and support a valuable member of the personal finance community in Singapore in the process, definitely sign up to be a Friend of StocksCafe (referral link)!
Seems like the list of supported exchanges is outdated though, he definitely supports the LSE.


Overall Thoughts
I’ve used StocksCafe since near the start of my investment journey, and while I consider myself much more hands-on than the average investor in terms of tracking (i.e. I have my own Google Sheets), I definitely appreciate the convenience, features and nice UI that StocksCafe provides. If you’re investing for the long term like PG and I are, tracking your portfolio is a definite must. If you’re really interested or insistent in doing it yourself, props to you, but if you’re not and are willing to try out what someone else has created, definitely give StocksCafe a try.
If you like it enough like many of us have, definitely subscribe if you would like access to the member features. If you want a free trial of the premium features, get it here! Else, their website has all the other information you need 🙂